Monitoring#
Note
This page is under active development.
Overview#
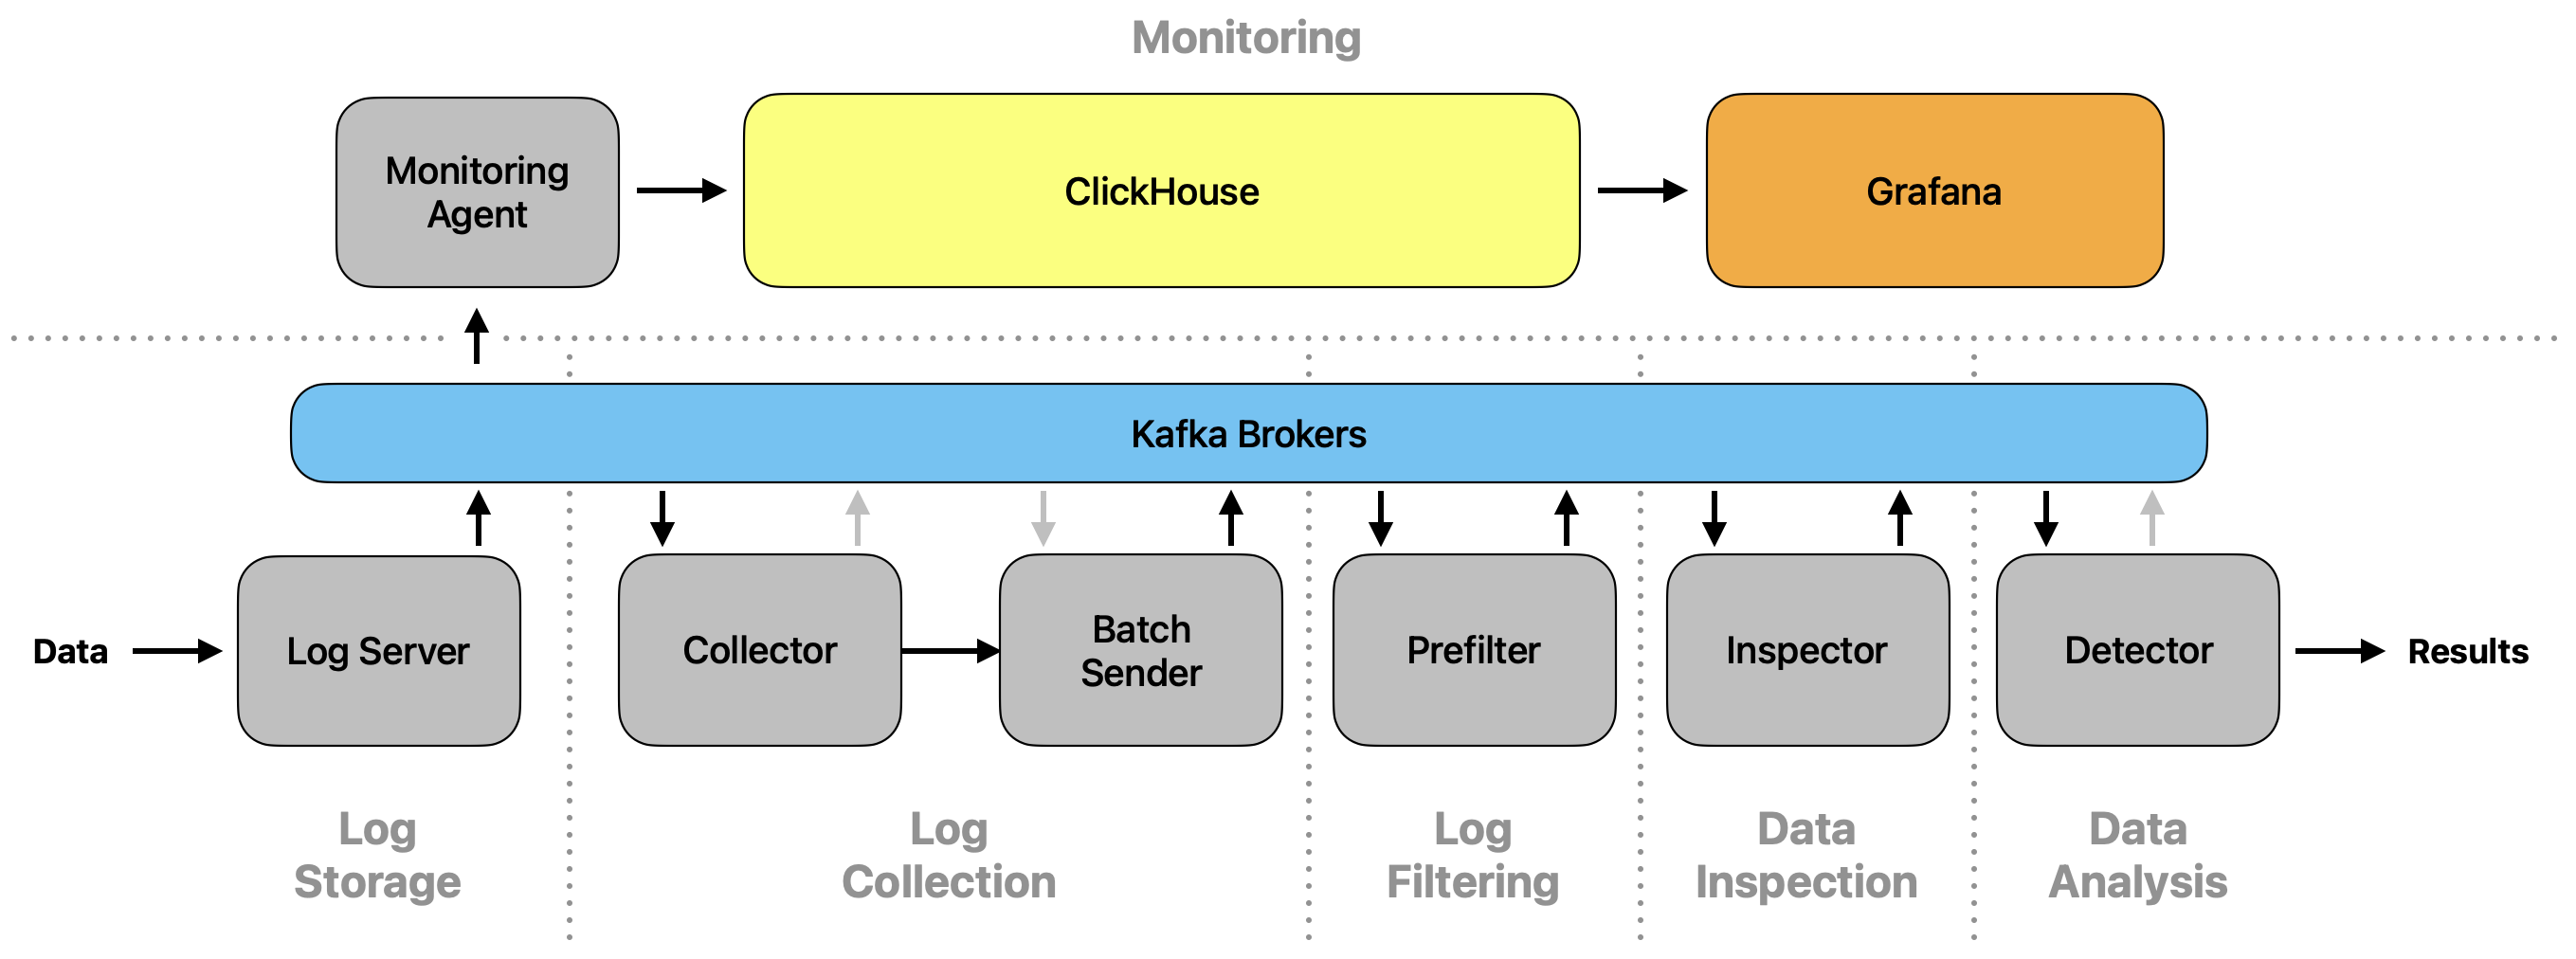
The software includes a monitoring functionality that stores relevant information in a database (ClickHouse). The collected data is then visualized using multiple Grafana dashboard views.
Setup#
Normal mode#
Both, ClickHouse and Grafana can be executed as their own Docker container. All needed containers are started when executing:
$ HOST_IP=127.0.0.1 docker compose -f docker/docker-compose.yml up
All modules send their monitoring-relevant information to Kafka, from which it is then collected by the
Monitoring Agent module. This module checks their validity and resumes by storing the values in ClickHouse. By the
default configuration defined in docker-compose.yml, Grafana automatically loads the dashboard views and fills
them with the data in ClickHouse. The dashboard views can then be observed on localhost:3000 (by default).
Datatest mode#
For users interested in testing their own machine learning models used by the detection algorithm in the Data Analysis stage, the monitoring functionality can be started in the datatest mode:
$ HOST_IP=127.0.0.1 docker compose --profile datatest -f docker-compose.yml -f ./docker-compose/prod/docker-compose.datatest.yml up
Grafana then shows one more dashboard view, Datatests, that shows the confusion matrix for a testing dataset.
Make sure that you set the profile to datatest and use the additional docker-compose file
docker-compose/prod/docker-compose.datatest.yml.
Warning
This feature is in an early development stage!