Pipeline#
Overview#
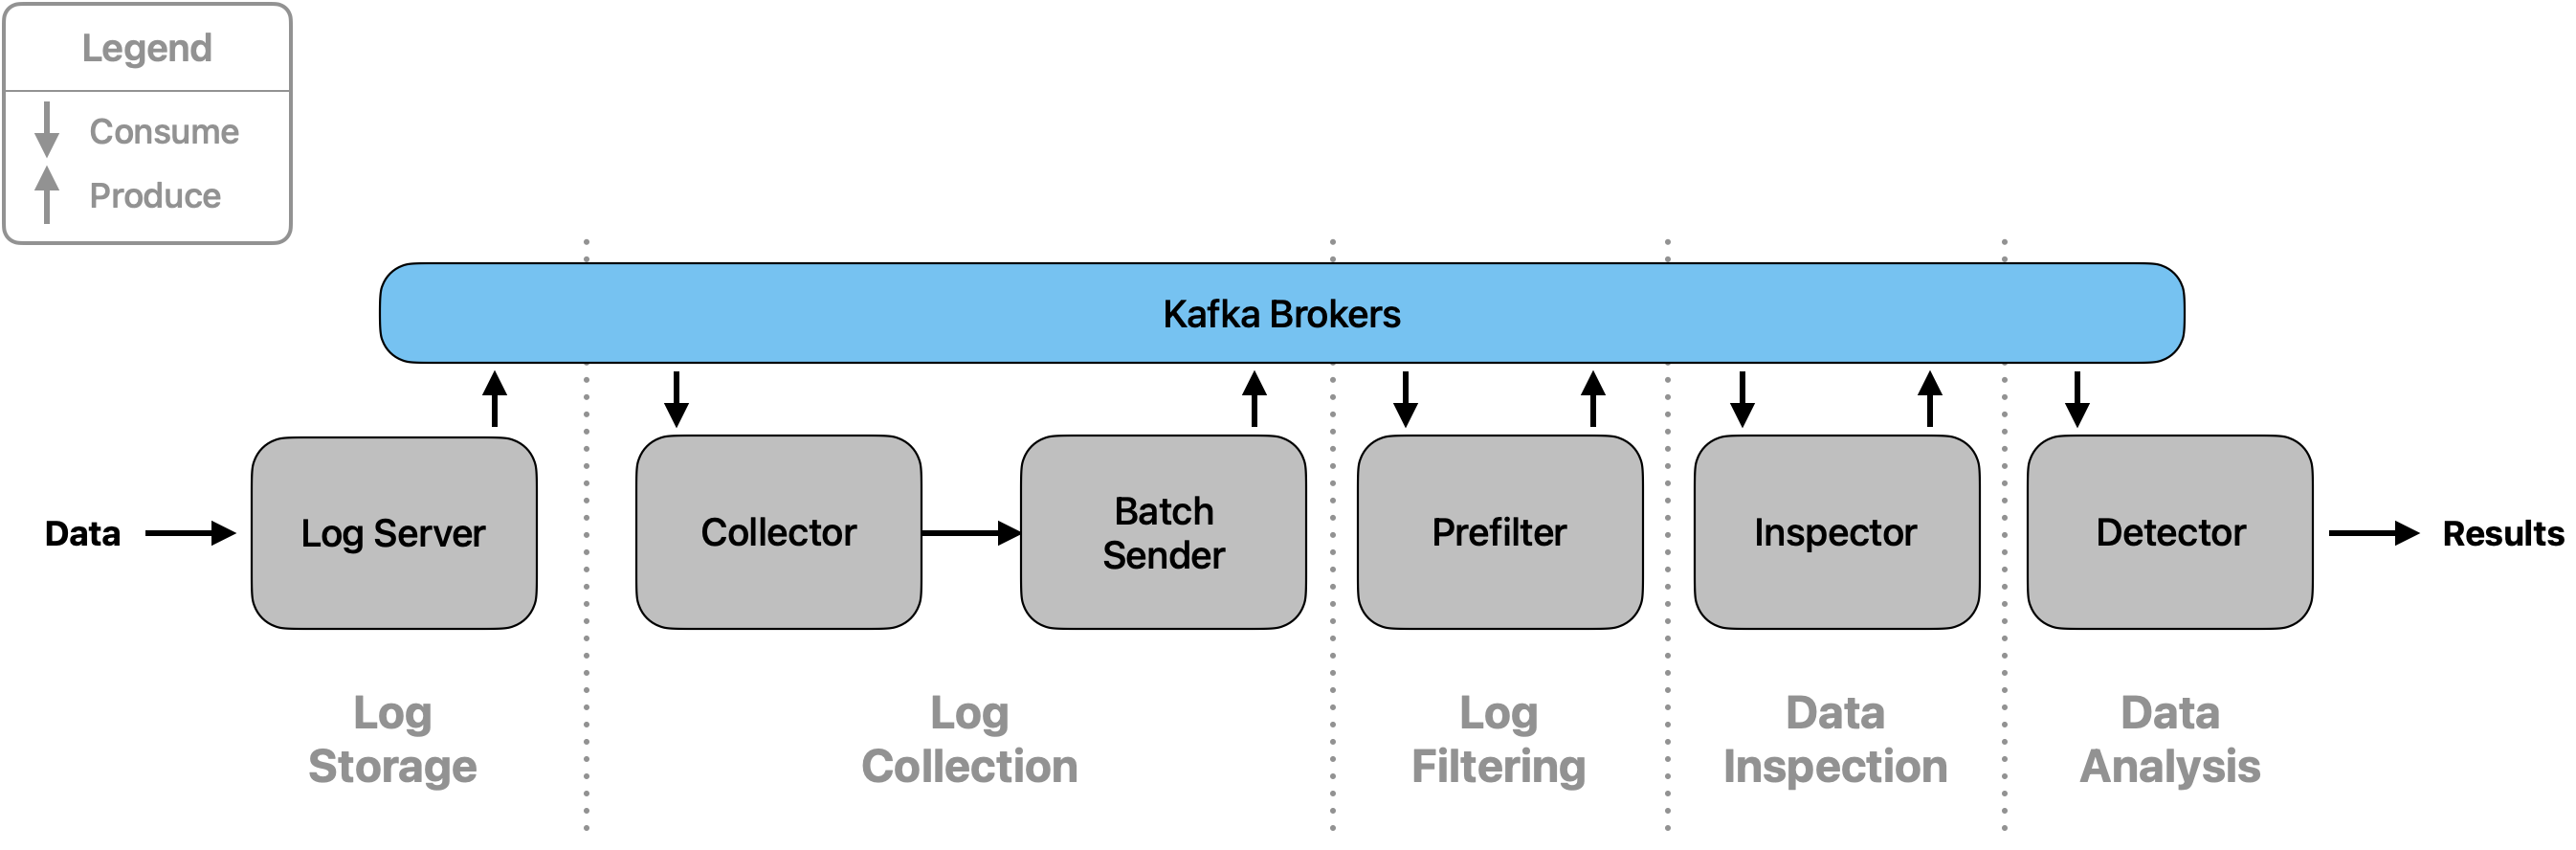
The core component of the software’s architecture is its data pipeline. It consists of five stages/modules, and data traverses through it using Apache Kafka.
Stage 1: Log Storage#
This stage serves as the central contact point for all data. Data is read and entered into the pipeline.
Overview#
The LogServer class is the core component of this stage. It reads data from one or multiple data sources and
enters it into the pipeline by sending it to Kafka, where it can be obtained by the following module. For monitoring,
it logs all ingoing log lines including their timestamps of entering and leaving the module.
Main Class#
- class src.logserver.server.LogServer[source]#
Main component of the Log Storage stage to enter data into the pipeline
Receives and sends single log lines. Simultaneously, listens for messages via Kafka and reads newly added lines from an input file. Sends every log line to a Kafka topic under which it is obtained by the next stage.
Usage and configuration#
The LogServer simultaneously listens on a Kafka topic and reads from an input file. The configuration
allows changing the Kafka topic to listen on, as well as the file name to read from.
The Kafka topic to listen on can be changed through setting the environment.kafka_topics.pipeline.logserver_in
field in config.yaml. Changing the file name to read from differs depending on your environment:
Without Docker:
To change the input file path, change
pipeline.log_storage.logserver.input_filein the config.yaml. The default setting is"/opt/file.txt".
With Docker:
Docker mounts the file specified in
MOUNT_PATHin the file docker/.env. By default, this is set to../../default.txt, which refers to the file docker/default.txt.By changing this variable, the file to be mounted can be set. Please note that in this case, the variable specified in the config.yaml must be set to the default value.
Stage 2: Log Collection#
The Log Collection stage validates and processes incoming loglines from the Log Storage stage, organizes them into batches based on subnet IDs, and forwards them to the next pipeline stage for further analysis.
Core Functionality#
The Log Collection stage is responsible for retrieving loglines from the Log Storage, parsing their information fields, and validating the data. Each field is checked to ensure it is of the correct type and format. This stage ensures that all data is accurate, reducing the need for further verification in subsequent stages.
Data Processing and Validation#
Any loglines that do not meet the required format are immediately discarded to maintain data integrity. The validation process includes data type verification and value range checks (e.g., verifying that IP addresses are valid). Only validated loglines proceed to the batching phase.
Batching and Performance Optimization#
Valid loglines are buffered and transmitted in batches after a pre-defined timeout or when the buffer reaches its
capacity. This minimizes the number of messages sent to the next stage and optimizes performance. The client’s IP
address is retrieved from the logline and used to create the subnet_id with the number of subnet bits specified
in the configuration.
Advanced Features#
The functionality of the buffer system is detailed in the subsection Buffer Functionality. This approach helps detect errors or attacks that may occur at the boundary between two batches when analyzed in later pipeline stages.
Overview#
The Log Collection stage comprises three main classes:
LogCollector: Connects to theLogServerto retrieve and parse loglines, validating their format and content. Addssubnet_idthat it retrieves from the client’s IP address in the logline.BufferedBatch: Buffers validated loglines with respect to theirsubnet_id. Maintains the timestamps for accurate processing and analysis per key (subnet_id). Returns sorted batches.BufferedBatchSender: Adds messages to the data structureBufferedBatch, maintains the timer and checks the fill level of the key-specific batches. Sends the key’s batches if full, sends all batches at timeout.
Main Classes#
- class src.logcollector.collector.LogCollector[source]#
Main component of the Log Collection stage to pre-process and format data
Consumes incoming loglines from the LogServer. Validates all data fields by type and value, invalid loglines are discarded. All valid loglines are sent to the BatchSender.
- class src.logcollector.batch_handler.BufferedBatch[source]#
Data structure for managing batches, buffers, and timestamps in the log collection pipeline
Manages two data structures: a current batch that collects incoming messages and a buffer that stores previously processed batch messages. The batch groups messages by key (typically subnet ID) and handles automatic sending when size or timeout limits are reached. All batches are sorted by timestamp to ensure chronological processing. Tracks batch metadata including IDs, timestamps, and fill levels for monitoring.
- class src.logcollector.batch_handler.BufferedBatchSender[source]#
Main component for managing batch collection and dispatch in the log collection stage
Coordinates the addition of messages to batches and handles automatic sending based on two triggers: size-based (when a batch reaches the configured size limit) or time-based (when a timeout expires). Manages a timer that ensures batches are sent even if they don’t reach the size threshold, preventing data from being held indefinitely. Sends completed batches to the next pipeline stage via Kafka and tracks message timestamps for monitoring and debugging purposes.
Usage#
LogCollector#
The LogCollector connects to the LogServer to retrieve one logline, which it then processes and
validates. The logline is parsed into its respective fields, each checked for correct type and format:
Field Validation:
Checks include data type verification and value range checks (e.g., verifying that an IP address is valid).
Only loglines meeting the criteria are forwarded to the
BufferedBatchSender.
Subnet Identification:
The configuration file specifies the number n of bits in a subnet (e.g. 24). The client’s IP address serves as a base for the
subnet_id. For this, the initial IP address is cut off after n bits, the rest is filled with zeros, and_nis added to the end of thesubnet_id. For example:Client IP address
Subnet ID
171.154.4.17171.154.4.0_24
Connection to LogServer:
The
LogCollectorestablishes a connection to theLogServerand retrieves loglines when they become available.
Log Line Format:
By default, log lines have the following format:
TIMESTAMP STATUS CLIENT_IP DNS_IP HOST_DOMAIN_NAME RECORD_TYPE RESPONSE_IP SIZE
Field
Description
TIMESTAMPThe date and time when the log entry was recorded. The format is configurable through the
logline_formatinconfig.yaml.Default Format:
%Y-%m-%dT%H:%M:%S.%fZ(ISO 8601 with microseconds and UTC).Example:
2024-07-28T14:45:30.123456Z
The format can be customized by modifying the timestamp configuration in the pipeline configuration file.
STATUSThe status of the DNS query, e.g.,
NOERROR,NXDOMAIN.CLIENT_IPThe IP address of the client that made the request.
DNS_IPThe IP address of the DNS server processing the request.
HOST_DOMAIN_NAMEThe domain name being queried.
RECORD_TYPEThe type of DNS record requested, such as
AorAAAA.RESPONSE_IPThe IP address returned in the DNS response.
SIZEThe size of the DNS query response in bytes. Represented in the format like
150b, where the number indicates the size andbdenotes bytes.Users can change the format and field types, as described in the Logline format configuration section.
BufferedBatch#
The BufferedBatch manages the buffering of validated loglines as well as their timestamps and batch metadata:
Batching Logic and Buffering Strategy:
Collects log entries into a
batchdictionary, with thesubnet_idas key.Uses a
bufferper key to concatenate and send both the current and previous batches together.This approach helps detect errors or attacks that may occur at the boundary between two batches when analyzed in Stage 4: Inspection and Stage 5: Detection.
All batches get sorted by their timestamps at completion to ensure correct chronological order.
A begin_timestamp and end_timestamp per key are extracted and sent as metadata (needed for analysis). These are taken from the chronologically first and last message in a batch.
Tracks batch IDs, timestamps, and fill levels for comprehensive monitoring and debugging.
Monitoring and Metadata:
Each batch is assigned a unique batch ID for tracking purposes.
Logs associations between loglines and their respective batches.
Maintains fill level statistics for both batches and buffers.
Records batch status changes (waiting, completed) with timestamps.
BufferedBatchSender#
The BufferedBatchSender manages the sending of validated loglines stored in the BufferedBatch:
Timer-based and Size-based Triggers:
Starts a timer upon receiving the first log entry.
When a batch reaches the configured size (e.g., 1000 entries), the current and previous batches of this key are concatenated and sent to the Kafka topic
batch_sender_to_prefilter.Upon timer expiration, the currently stored batches of all keys are sent. Serves as backup if batches don’t reach the configured size.
If no messages are present when the timer expires, nothing is sent.
Message Processing and Monitoring:
Extracts logline IDs from JSON messages for tracking purposes.
Logs processing timestamps (in_process, batched) for each message.
Provides detailed logging about the number of messages and batches sent.
Uses the Batch schema for serialization before sending to Kafka.
Configuration#
The LogCollector checks the validity of incoming loglines. For this, it uses the logline_format
configured in the config.yaml. Section Logline format configuration provides detailed information
on how to customize the logline format and field definitions. The LogCollector uses the following
configuration options from the configuration:
LogCollector Analyzation Criteria:
Valid status codes: The accepted status codes for logline validation. This is defined in the field with name
"status_code"in thelogline_formatlist.Valid record types: The accepted DNS record types for logline validation. This is defined in the field with name
"record_type"in thelogline_formatlist.
Buffer Functionality#
The BufferedBatch class manages the batching and buffering of messages associated with specific keys, along
with the corresponding timestamps. The class ensures efficient data processing by maintaining two sets of messages -
those currently being batched and those that were part of the previous batch. It also tracks the necessary timestamps
to manage the timing of message processing.
Class Overview#
Batch: Stores the latest incoming messages associated with a particular key.
Buffer: Stores the previous batch of messages associated with a particular key.
Batch ID: Unique identifier assigned to each batch for tracking and monitoring purposes.
Monitoring Databases: Tracks logline-to-batch associations, batch timestamps, and fill levels for comprehensive monitoring.
Key Procedures#
Message Arrival and Addition:
When a new message arrives, the
add_message()method is called.If the key already exists in the batch, the message is appended to the list of messages for that key.
If the key does not exist, a new entry is created in the batch with a unique batch ID.
Batch timestamps and logline-to-batch associations are logged for monitoring.
Example:
message_1arrives forkey_1and is added tobatch["key_1"].
Retrieving Message Counts:
Use
get_message_count_for_batch_key(key)to get the count of messages in the current batch for a specific key.Use
get_message_count_for_buffer_key(key)to get the count of messages in the buffer for a specific key.Use
get_message_count_for_batch()to get the total count across all batches.Use
get_message_count_for_buffer()to get the total count across all buffers.
Completing a Batch:
The
complete_batch()method is called to finalize and retrieve the batch data for a specific key.Scenarios:
Variant 1: If only the current batch contains messages (buffer is empty), the batch is returned sorted by and with its timestamps.
begin_timestampreflects the timestamp of the first message in the batch, andend_timestampthe timestamp of the chronologically last message in the batch.Variant 2: If both the batch and buffer contain messages, the buffered messages are included in the returned data. The
begin_timestampnow reflects the first message’s timestamp in the buffer instead of the batch.Variant 3: If only the buffer contains messages (no new messages arrived), the buffer data is discarded.
Variant 4: If neither the batch nor the buffer contains messages, a
ValueErroris raised.
Managing Stored Keys:
The
get_stored_keys()method returns a set of all keys currently stored in either the batch or the buffer, allowing the retrieval of all keys with associated messages or buffered data.
Example Workflow#
Initial Message:
message_1arrives forkey_1, added tobatch["key_1"].
Subsequent Message:
message_2arrives forkey_1, added tobatch["key_1"].
Completing the Batch:
complete_batch("key_1")is called, and ifbuffer["key_1"]exists, it includes both buffered and batch messages, otherwise just the batch.The current batch is moved to the buffer.
Buffer Management:
If no new messages arrive,
buffer["key_1"]data is discarded upon the next call tocomplete_batch("key_1").
This class design effectively manages the batching and buffering of messages, allowing for precise timestamp tracking and efficient data processing across different message streams.
Stage 3: Log Filtering#
The Log Filtering stage processes batches from the Log Collection stage and filters out irrelevant entries based on configurable relevance criteria, ensuring only meaningful data proceeds to anomaly detection.
Core Functionality#
The Log Filtering stage is responsible for processing and refining log data by filtering out entries based on relevance criteria defined in the logline format configuration. This step ensures that only relevant logs are passed on for further analysis, optimizing the performance and accuracy of subsequent pipeline stages.
Data Processing Pipeline#
The filtering process operates on complete batches rather than individual loglines, maintaining batch metadata and timestamps throughout the process. Each batch is processed as a unit, preserving the subnet-based grouping established in the previous stage.
Relevance-Based Filtering#
The filtering mechanism uses the check_relevance() method from the LoglineHandler to determine which
entries should proceed to the next stage. This approach allows for flexible filtering criteria based on field values
defined in the configuration.
Main Class#
- class src.prefilter.prefilter.Prefilter[source]#
Main component of the Log Filtering stage to process and filter batches
Consumes batches from the Log Collection stage and applies relevance-based filtering using the
LoglineHandler. Filters out irrelevant loglines and forwards only relevant data to the next pipeline stage for anomaly detection.
Usage#
Data Flow and Processing#
The Prefilter consumes batches from the Kafka topic batch_sender_to_prefilter and processes them through
the following workflow:
Batch Reception: Receives complete batches with metadata (batch_id, begin_timestamp, end_timestamp, subnet_id)
Relevance Filtering: Applies relevance checks to each logline within the batch
Monitoring: Tracks filtered and unfiltered data counts for monitoring purposes
Batch Forwarding: Sends filtered batches to the
prefilter_to_inspectortopic
Filtering Logic#
The filtering process:
Retains loglines that pass the relevance check defined by
ListItemfield configurationsDiscards irrelevant loglines and marks them as “filtered_out” in the monitoring system
Preserves batch structure and metadata for filtered data
Handles empty batches gracefully (logs info but does not forward empty data)
Error Handling#
The implementation includes robust error handling:
Empty Data: Logs informational messages when batches contain no data
No Filtered Data: Raises
ValueErrorwhen no relevant data remains after filteringKafka Exceptions: Continues processing on message fetch exceptions
Graceful Shutdown: Supports
KeyboardInterruptfor clean termination
Configuration#
Filtering behavior is controlled through the logline_format configuration in config.yaml:
Relevance Criteria:
For fields of type
ListItem, the fourth entry (relevant_list) defines which values are considered relevantIf no relevant_list is specified, all allowed values are deemed relevant
Multiple fields can have relevance criteria, and all must pass for a logline to be retained
Example Configuration:
logline_format:
  - [ "status_code", ListItem, [ "NOERROR", "NXDOMAIN" ], [ "NXDOMAIN" ] ]  # Only NXDOMAIN relevant
  - [ "record_type", ListItem, [ "A", "AAAA" ] ]  # A and AAAA relevant
Monitoring and Metrics#
The Prefilter provides comprehensive monitoring:
Batch Processing: Tracks batch timestamps and processing status
Fill Levels: Monitors data volumes before and after filtering
Logline Tracking: Records “filtered_out” status for individual loglines
Performance Metrics: Logs processing statistics for each batch
Stage 4: Inspection#
Overview#
The Inspection stage performs time-series-based anomaly detection on prefiltered DNS request batches. Its primary purpose is to reduce the load on the Detection stage by filtering out non-suspicious traffic early.
This stage uses StreamAD models—supporting univariate, multivariate, and ensemble techniques—to detect unusual patterns in request volume and packet sizes.
Main Class#
- class src.inspector.inspector.Inspector[source]#
Main component of the Data Inspection stage to detect anomalies in request batches
Analyzes batches of DNS requests using configurable streaming anomaly detection models. Supports univariate, multivariate, and ensemble detection modes. Processes time series features from DNS request patterns to identify suspicious network behavior and forwards anomalous batches to the Detector for further analysis.
The Inspector class is responsible for:
Loading batches from Kafka
Extracting time-series features (e.g., frequency and packet size)
Applying anomaly detection models
Forwarding suspicious batches to the detector stage
Usage#
Data Flow and Processing#
The Inspector consumes batches from the Kafka topic prefilter_to_inspector and processes them through
the following workflow:
Batch Reception: Receives batches with metadata (batch_id, begin_timestamp, end_timestamp) from the Prefilter
Time Series Construction: Creates time series features based on configurable time windows
Anomaly Detection: Applies StreamAD models to detect suspicious patterns
Threshold Evaluation: Evaluates anomaly scores against configured thresholds
Suspicious Batch Forwarding: Groups and forwards anomalous data by client IP to the Detector
Time Series Feature Extraction#
The Inspector creates time series features using sliding non-overlapping windows:
Time Window Configuration: Based on
time_type(e.g.,ms) andtime_range(e.g.,20) from configurationUnivariate Mode: Counts message occurrences per time step for single-feature anomaly detection
Multivariate Mode: Combines message counts and mean packet sizes for two-dimensional feature analysis
Ensemble Mode: Uses message counts with multiple models combined through ensemble methods
Anomaly Detection Logic#
The anomaly detection process evaluates suspicious patterns through a two-level threshold system:
Score Threshold: Individual time steps are flagged as anomalous when scores exceed
score_threshold(default: 0.5)Anomaly Threshold: Batches are considered suspicious when the proportion of anomalous time steps exceeds
anomaly_threshold(default: 0.01)Client IP Grouping: Suspicious batches are grouped by client IP and forwarded as separate suspicious batches to the Detector
Error Handling and Monitoring#
The implementation includes comprehensive monitoring and error handling:
Busy State Management: Prevents new batch consumption while processing current data
Model Validation: Validates model compatibility with selected detection mode
Fill Level Tracking: Monitors data volumes throughout the processing pipeline
Graceful Degradation: Handles empty batches and model loading failures appropriately
Configuration#
The Inspector supports comprehensive configuration through the data_inspection.inspector section in config.yaml.
All StreamAD models are supported, including univariate, multivariate, and ensemble methods.
Detection Modes#
Three detection modes are available:
Univariate Mode (
mode: univariate): Uses message count time series for anomaly detectionMultivariate Mode (
mode: multivariate): Combines message counts and mean packet sizesEnsemble Mode (
mode: ensemble): Uses multiple models with ensemble combination methods
Model Configuration#
Univariate Models (streamad.model):
ZScoreDetector: Statistical anomaly detection using z-scoresKNNDetector: K-nearest neighbors based detectionSpotDetector: Streaming peaks-over-threshold detectionSRDetector: Spectral residual based detectionOCSVMDetector: One-class SVM for anomaly detectionMadDetector: Median absolute deviation detectionSArimaDetector: Streaming ARIMA-based detection
Multivariate Models (streamad.model):
xStreamDetector: Multi-dimensional streaming detectionRShashDetector: Random projection hash-based detectionHSTreeDetector: Half-space tree based detectionLodaDetector: Lightweight online detector of anomaliesOCSVMDetector: One-class SVM (supports multivariate)RrcfDetector: Robust random cut forest detection
Ensemble Methods (streamad.process):
WeightEnsemble: Weighted combination of multiple detectorsVoteEnsemble: Voting-based ensemble prediction
Configuration Parameters#
data_inspection:
  inspector:
    mode: univariate                    # Detection mode: univariate, multivariate, ensemble
    models:                             # List of models to use
      - model: ZScoreDetector
        module: streamad.model
        model_args:
          is_global: false
    ensemble:                           # Ensemble configuration (when mode: ensemble)
      model: WeightEnsemble
      module: streamad.process
      model_args: {}
    anomaly_threshold: 0.01            # Proportion of anomalous time steps required
    score_threshold: 0.5               # Individual score threshold for anomaly detection
    time_type: ms                      # Time unit for window creation
    time_range: 20                     # Time range for each window step
Model Arguments: Custom arguments for specific models can be provided via the model_args dictionary.
This allows fine-tuning of model parameters for specific deployment requirements.
Time Window Settings: The time_type and time_range parameters control the granularity of time series analysis.
Current configuration uses 20-millisecond windows for high-resolution anomaly detection.
Stage 5: Detection#
Overview#
The Detection stage is the core of the heiDGAF pipeline. It consumes suspicious batches passed from the Inspector, applies pre-trained ML models to classify individual DNS requests, and issues alerts based on aggregated probabilities.
The pre-trained models used here are licensed under EUPL‑1.2 and built from the following datasets:
Main Class#
- class src.detector.detector.Detector[source]#
Main component of the Data Analysis stage to perform anomaly detection
Processes suspicious batches from the Inspector using configurable ML models to classify DNS requests as benign or malicious. Downloads and validates models from a remote server, extracts features from domain names, calculates probability scores, and generates alerts when malicious requests are detected above the configured threshold.
The Detector class:
Consumes a batch flagged as suspicious.
Downloads and validates the ML model (if necessary).
Extracts features from domain names (e.g. character distributions, entropy, label statistics).
Computes a probability per request and an overall risk score per batch.
Emits alerts to ClickHouse and logs in
/tmp/warnings.jsonwhere applicable.
Usage#
The Detector listens on the Kafka topic from the Inspector (
inspector_to_detector).For each suspicious batch: - Extracts features for every domain request. - Applies the loaded ML model (after scaling) to compute class probabilities. - Marks a request as malicious if its probability exceeds the configured threshold.
Computes an overall score (e.g. median of malicious probabilities) for the batch.
If malicious requests exist, issues an alert record and logs it; otherwise, the batch is filtered.
Alerts are recorded in ClickHouse and also appended to a local JSON file (warnings.json) for external monitoring.
Configuration#
You may use the provided, pre-trained models or supply your own. To use a custom model, specify:
base_url: URL from which to fetch model artifacts
model: model name
checksum: SHA256 digest for integrity validation
threshold: probability threshold for classifying a request as malicious
These parameters are loaded at startup and used to download, verify, and load the model/scaler if not already cached locally (in temp directory).